One of the most valuable tools I use every year to answer the above question is a heat map. No, this doesn’t chart the rising June temperatures—a necessary hardship to endure while waiting for the cooling, monsoon rains of July and August. The heat map is actually a statistical tool used to gauge any price increases on vacant land sales from one year to the next.
How do I read this thing?
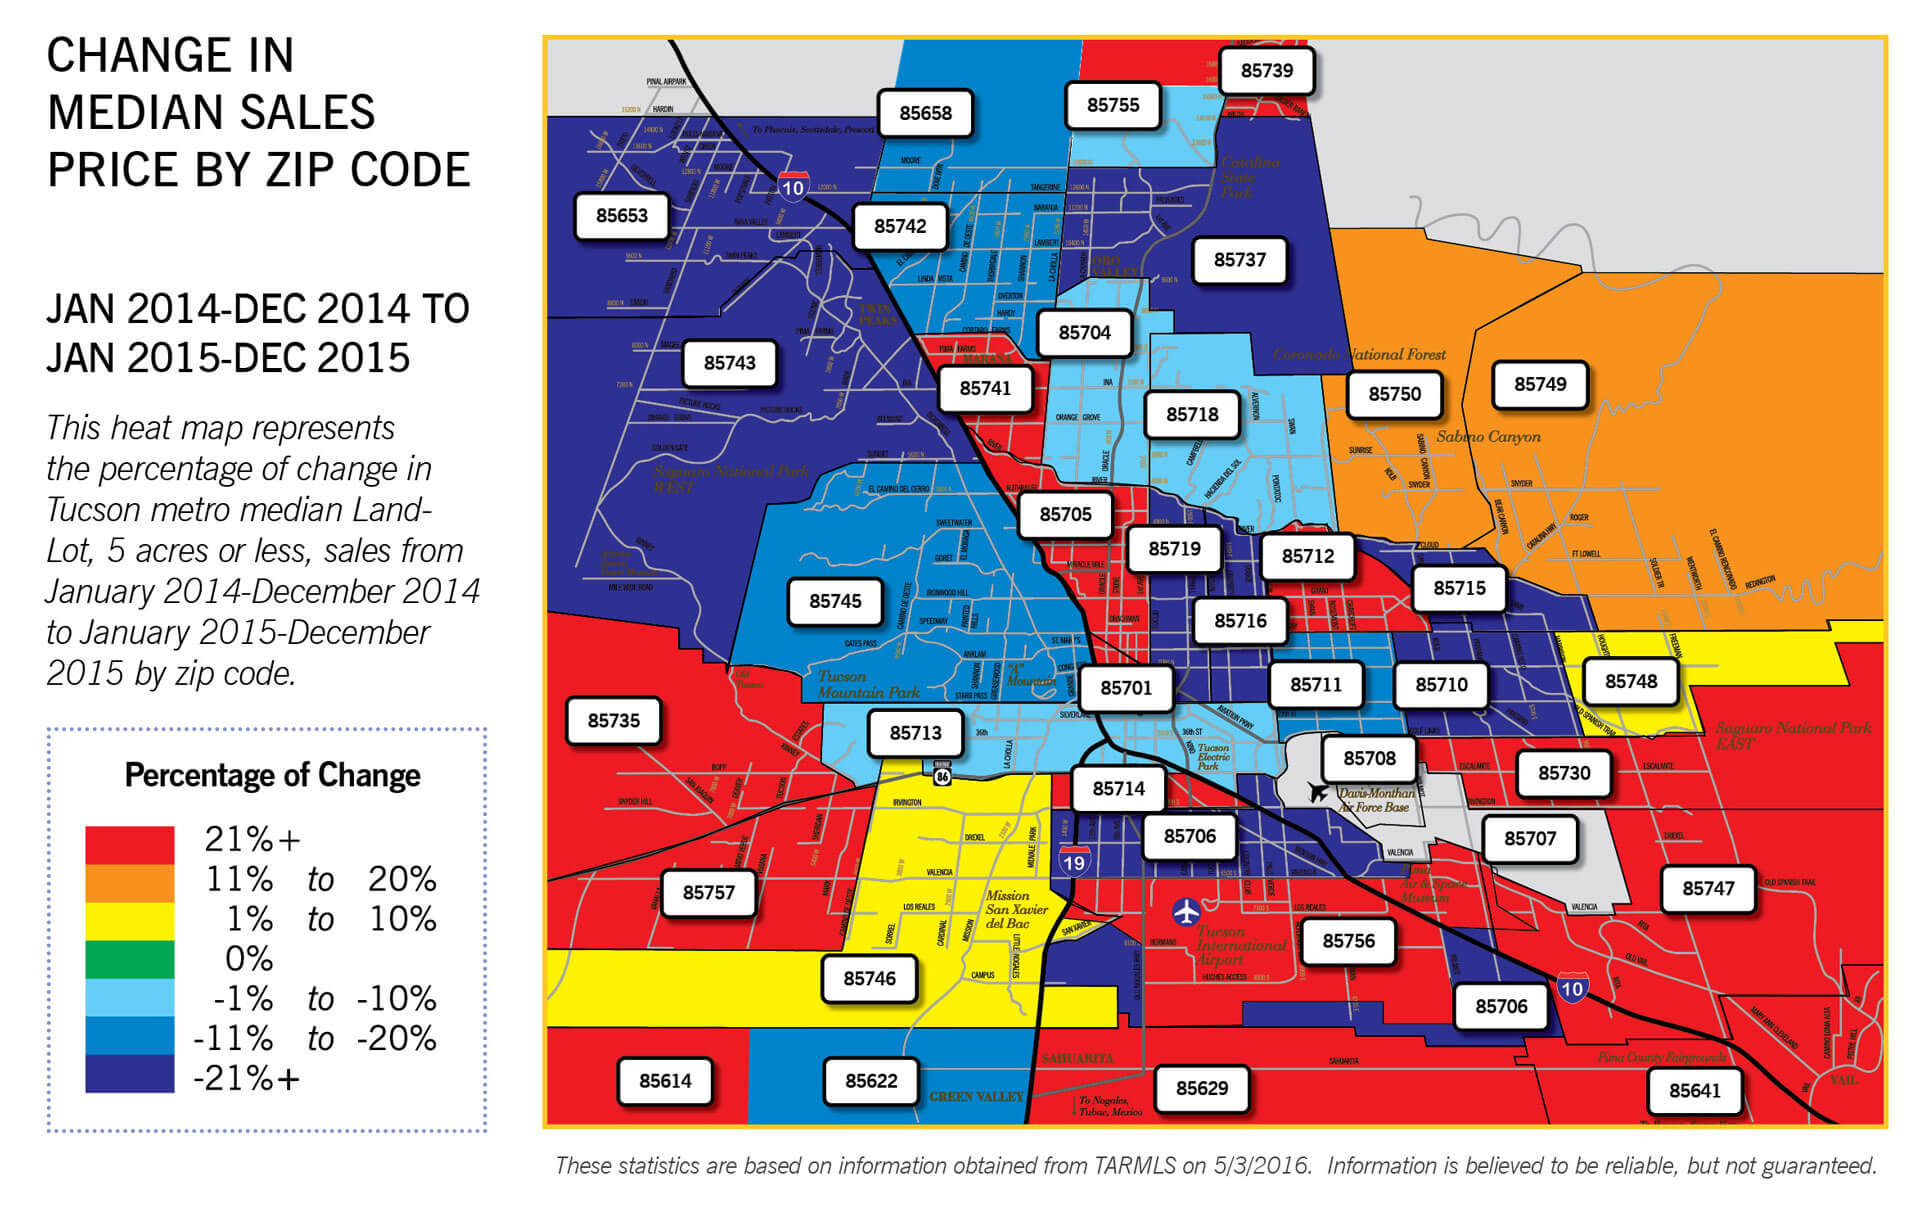
The map categorizes these by individual zip codes (the information is taken from the Tucson Multiple Listing Service). It’s called a heat map because, as you can see, where land prices have increased the most, or are “the hottest,” the areas are a bright red color and the “cooler areas,” which have experienced the greatest decrease in value, are depicted in a deep blue.
These hot and cool colors vary from bright red to oranges and yellows before fading into different shades of blue. This type of representation provides a quick and easy visual reference when it comes to evaluating year-long trends in land prices.
Heat maps help answer important questions.
Should I sell my property now or wait a while longer?
Is this a good time to buy a specific parcel?
Is this part of Tucson a good area for investment property?
What kind of appreciation should I expect for my vacant land?
In comparing heat maps, year to year trends become apparent which leads to more well informed and timely business decisions.
How is the heat map’s information used in the real world?
To more thoroughly understand these trends let’s look at the specific land inventories and sales in several zip codes. Reference this year’s heat map as you read along.
A 21% increase over the past year…
The 85730 and 85747 zip codes represent the Houghton/Escalante corridors. Both areas experienced land value increases at an average of over 21% this past year. Land prices in both areas were soft for a period of time, but in the 85730 zip code, sales of unsubdivided land on Escalante and Pinal Vista Rds, as well as increased prices in Rancho Cancion East and West, and Highland Trails Subdivisions, in the amount of up to $124K, have bolstered the area. A little further south and east, higher sales prices in the Irvington/Old Spanish Trail, Rocking K, and Camino Loma Alta areas, are responsible for the increased average in zip code 85747.
Affordable, convenient, and an appreciation of 21+%!
Zip codes 85735 and 85757 on Tucson’s far southwest side have been areas
with some of the lower land prices in the metropolitan area with median land prices in the mid $20K price range. Recent sales along the Ajo Road corridor, the Sandario Rd area and the Bopp/Kinney area have increased into the mid $30Ks and thus account for red, hot, 21%+ appreciation area this past year. Considering affordable prices, excellent roads, and quick access to shopping, medical services, downtown Tucson and local employment centers, this is seen as an upcoming area!
Strong, annual appreciation in these Tucson locales…
Land in both the Catalina Foothills zip code of 85750, and the Tanque Verde Valley of 85749, have seen strong, annual appreciation in the 11%-20% range. Accounting for this increase in the Foothills are the custom lots in and immediately surrounding the Ventana Canyon master planned community area including The Ridge at Ventana, Ventana Vista, Ventana Country Club, Alta Vista and Cimarron Foothills Estates.
Also in this zip code were strong sales in the Cloud Rd corridor. Increases in land prices in the 85749 zip code were characterized by a large demand for unsubdivided, 3.3 acre sites which rose in price into the $180Ks as well as four sales in gated, Rancho Soldados in the $150K range and three sales in gated, Saguaro Hills Estates ranging up to $240K. Highly rated school systems helped both of these areas achieve these results.
Custom lots and new home construction lead to adjusted land prices.
Another notable trend of this year’s heat map is the declining price profile in the area with the largest inventory of custom lots: the north west side represented by zip codes 85737, 85742, 85755, and 85658. It encompasses all of Oro Valley, much of Marana, and the Tangerine Corridor. It is also home to several large, master planned communities, specifically La Reserve, Stone Canyon, and the communities within Dove Mountain. This area has been the most active in new home construction and development for the last several years which has driven demand and prices to high levels. These latest results, a decrease from 5%- over 20%, represent a market correction of land prices and a reflection that they were somewhat overheated or inflated relative to the rest of the Tucson land market. The prevalence of recent sale prices in the $100K-$200K range in both Stone Canyon and Canyon Pass Subdivisions support this.
Large land inventory decreased area land prices.
On Tucson’s westside, zip code 85745, has traditionally been a strong area of custom home lots due to it’s proximity to I-10, downtown Tucson, The University of Arizona and Tucson International Airport. The large inventory of lots appears to have caught up with this area as prices have most recently declined on average between 11% and 20%. SR zoned parcels, usually at 3.31 acres, have noticeably declined in value this past year with the great majority selling between $35,000-$100,000. Also 3 large, gated lots, all with full utilities and excellent views in the Estates at Starr Pass sold this past year between $84,000 and $95,000 a significant drop from previous prices.
Interested in learning more about land?
There is much to learn from studying this heat map whether you’re a land buyer or seller, a small home builder, a land investor, a land developer, a land appraiser or just someone who likes to keep tabs on what’s happening in the land market in our community.
If you’re any of these you might also enjoy receiving a free, monthly copy of my Tucson Land Report with ongoing summaries of our land market. Sign up here!
